Test Optional? It Depends
Is the 60% Percentile The new Median?
First, don’t freak out when you look at these numbers and see big increases in median ACT/SAT scores. That doesn’t mean it’s necessarily harder for any one individual to get into college now than it was before test optional policies were in full swing.
Please note that this discussion pertains to data from the Common Data Sets and is for enrolled students, not accepted students. Unfortunately, our less-than-transparent friends (aka colleges) don’t release data about who was/wasn’t admitted with/without test scores.
And forgetting test score data for a moment, keep in mind that a 25%, 50% 100% increase in applicants doesn’t mean a 25%, 50% 100% increase in qualified applicants. So, a lower overall acceptance rate doesn’t necessarily mean it’s more difficult for you; it really doesn’t shed much light at all on your individual prospects.
Here are my two main takeaways from the comparative Common Data Set information we compiled. (How weird am I that I love spending hours perusing Common Data sets?)
Higher median ACT/SAT test scores are artificially inflated.
Let me explain.
Imagine a world in which every student must take the ACT or SAT, but not every student must submit their score. If we knew the scores of enrollees who chose not to submit their scores, then we could determine the median test score for all enrollees. Now, imagine this: what if all the enrollees whose test scores were in the bottom 20% chose not to submit scores? Now, the median score of the remaining 80% of enrollees will be in the 60% percentile of the whole enrollee pool. If you only look at the medians, it looks as if admissions became more competitive, but this is an artificial/inflated result of looking only at a truncated sample: only enrollees who chose to submit
2. *The Pat advice “don’t submit test scores below the median (50%)” doesn’t make mathematical sense.*
Half of enrollees who submitted scores, submitted scores below the median: that’s the definition of median!
Even forgetting kids at the lower end of the test score range who may be athletes, development prospects, et. al. There’s still a whole swath of kids who are submitting test scores below the median.
*Keep in mind, however, in deciding whether to submit your ACT/SAT score or not, you’d want to factor in the relative ACT/SAT score submit rate for a given institution and consider your individual/high school context. For example, the decision for U Mass Amherst, where the overall ACT/SAT submit rate is around 31%, would differ from that for U. Michigan where the ACT/SAT submit closer to 86%.
Looking At Common Data Set Comparisons
Note regarding the last column: I acknowledge that the last column will include some duplication: enrollees who submitted both ACT and SAT scores. Unfortunately, I have not found any official data on how many students do that on average. But anecdotally, tutors in my professional groups report a very low number of students who take both tests. And among those students, even fewer will submit both scores.
We believe Our Previous Insights About Test Optional Hold True in 2023.
I won’t rehash all our previous insights in this post, but you can read our first Test Optional Post.
Rampant grade inflation is one reason certain colleges still prefer test scores. Read our post on grade inflation and test scores for more insight. But I can also tell you from the perspective of our own work that this makes sense. This year, we worked with our largest and most academically diverse group of students and we found that nearly every student we worked with had an A- to A GPA; yet, their level of rigor and test scores varied dramatically.
Equity is another reason (among others) that MIT decided to revert to Test Required.

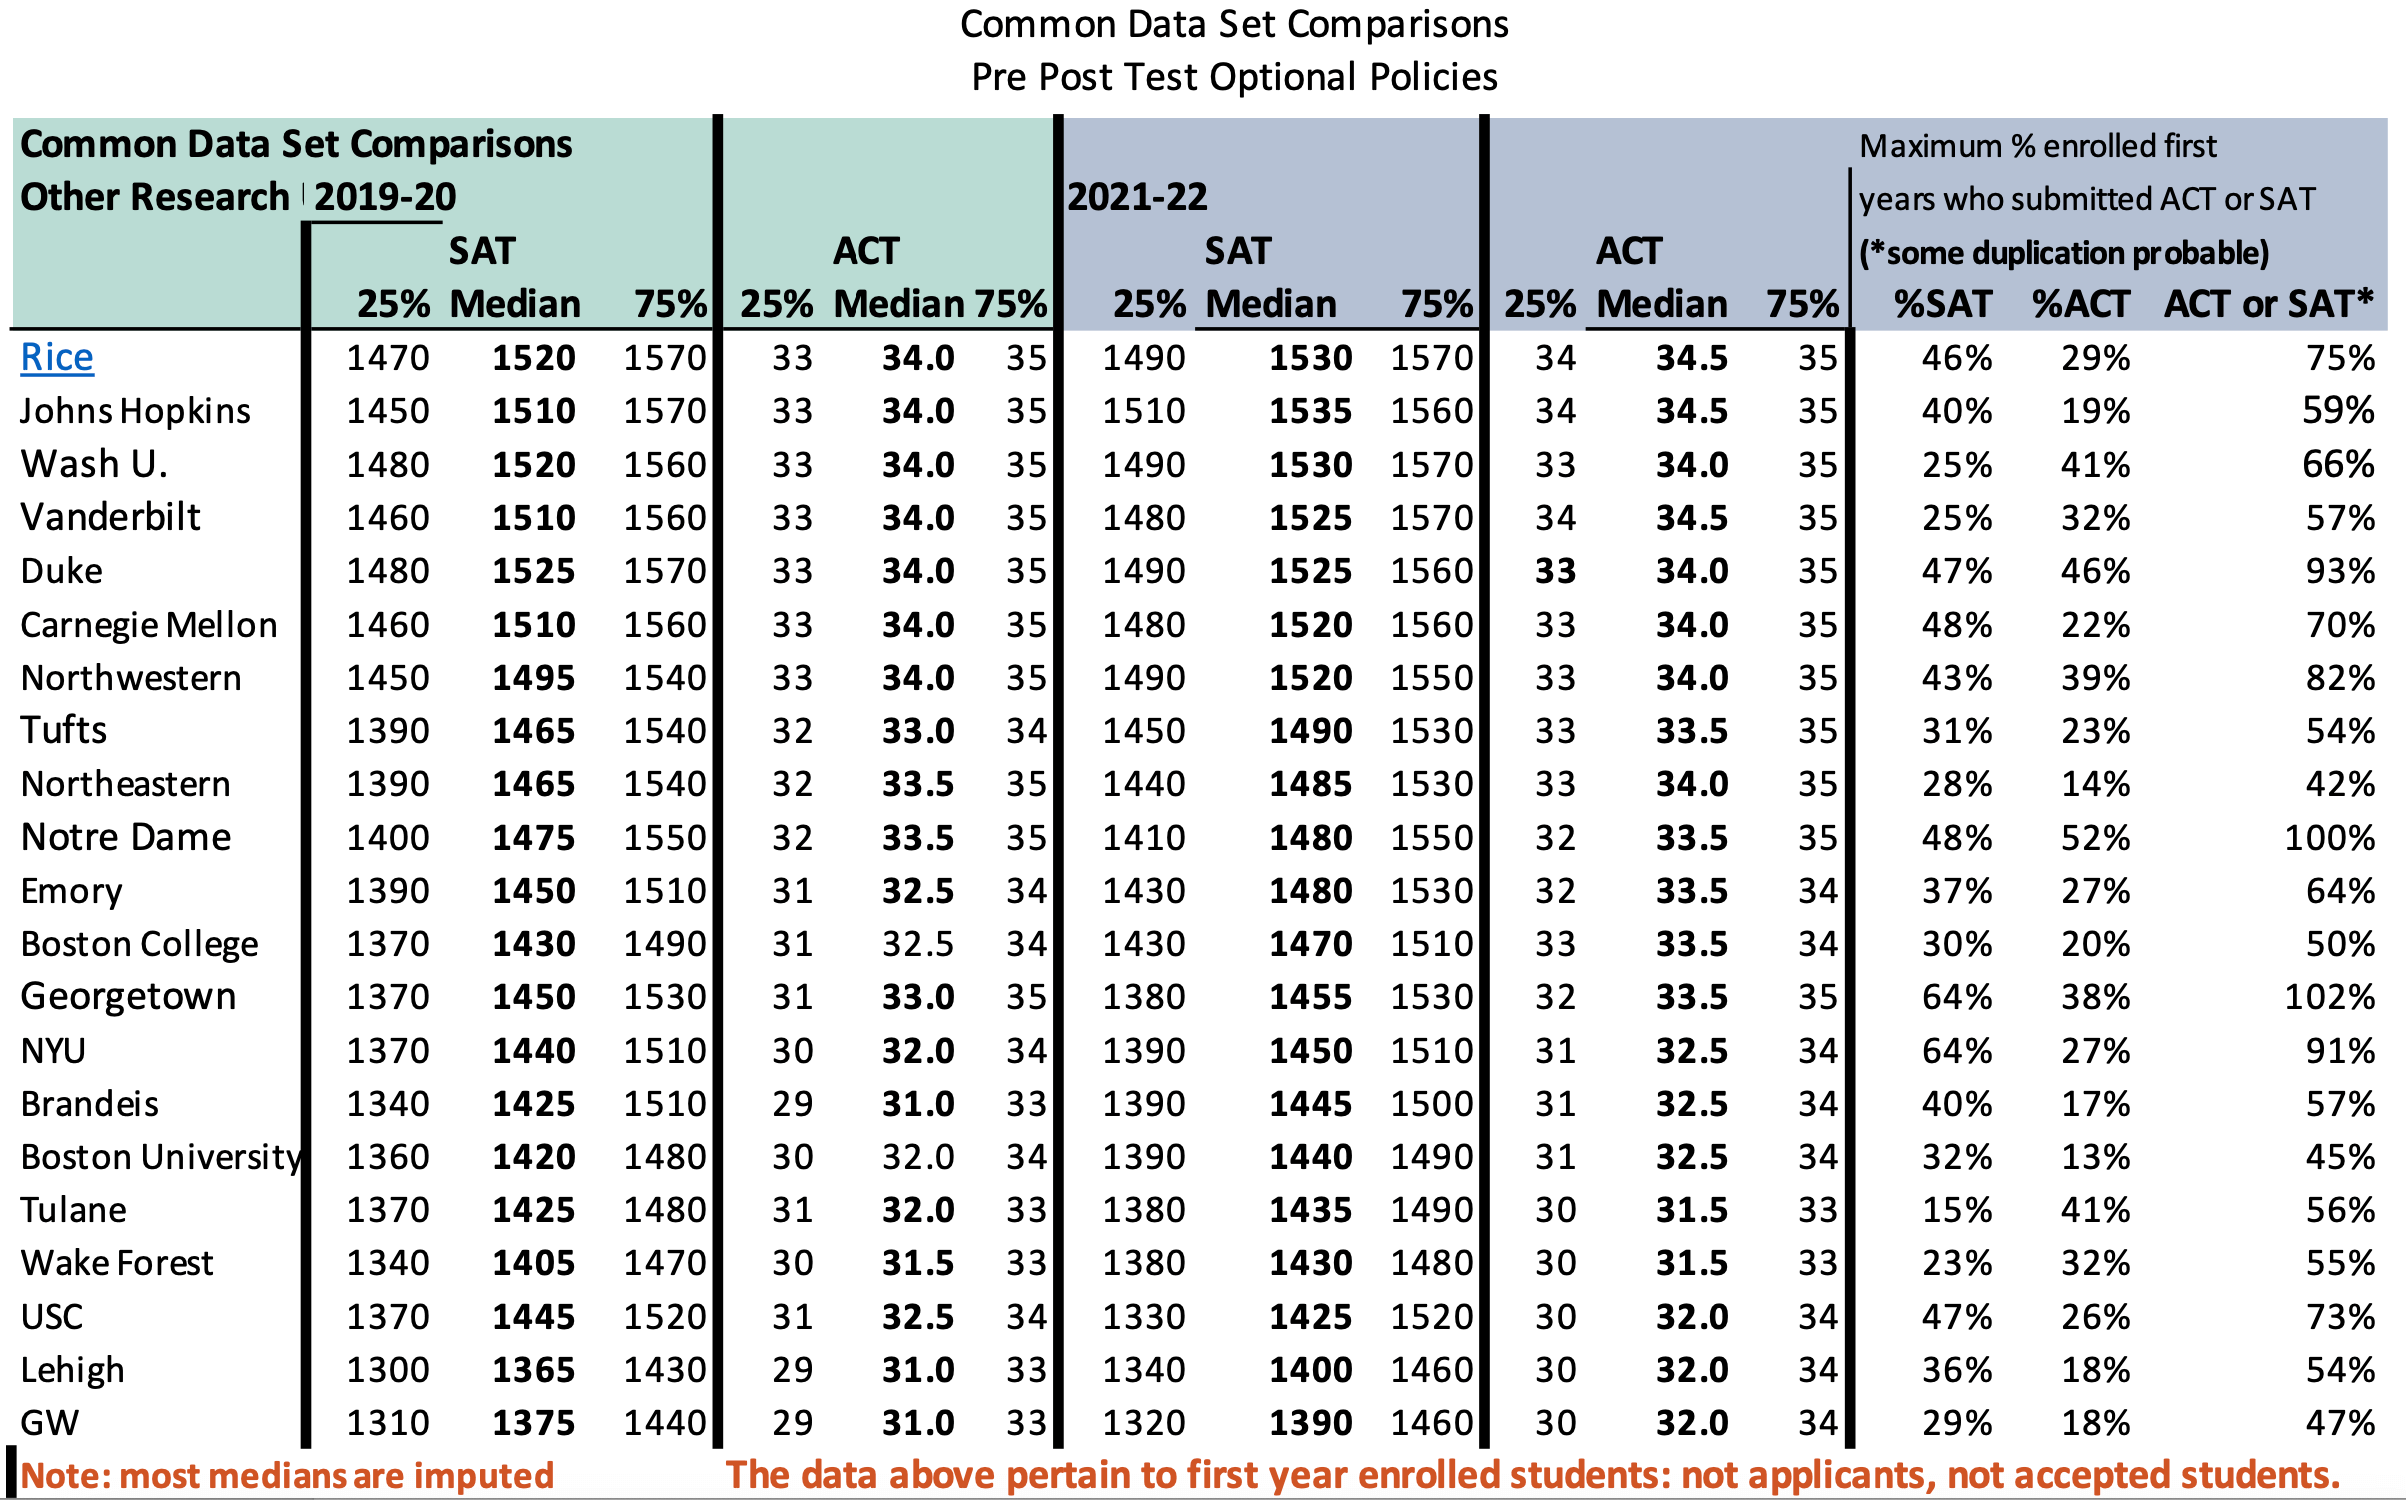
Selective Research Universities Common Data Set test score comparisons

Selective Liberal Arts Colleges (LACs) Common Data Set test score comparisons

Original Public Ivies Common Data Set test score comparisons
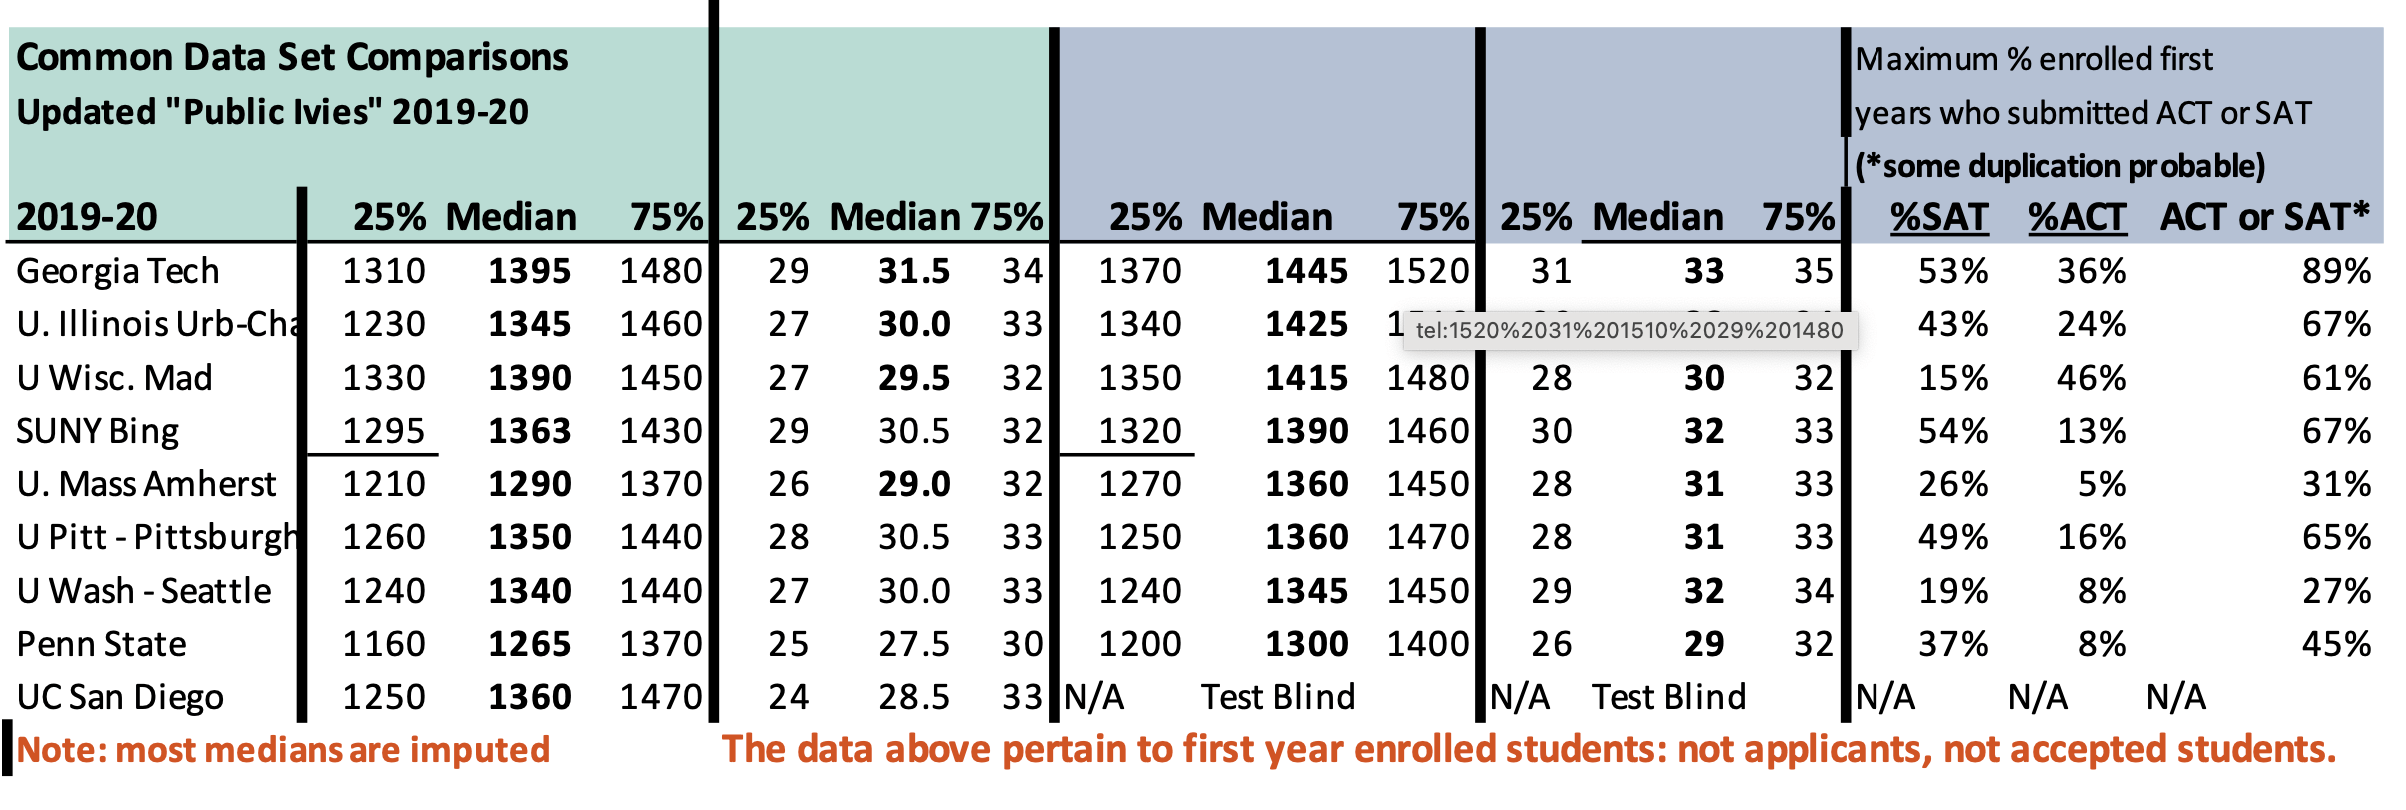
“Updated Public Ivies” Common Data Set test score comparisons
Reminder: ANY STUDENT can seriously improve test scores in 4-8 weeks’ time if they’re genuinely motivated and put in the effort. Just get the right materials and get to work – no tutor required!